
Double Bottom Line
Creating Social Value
SK’s DBL (Double Bottom Line) Management Philosophy
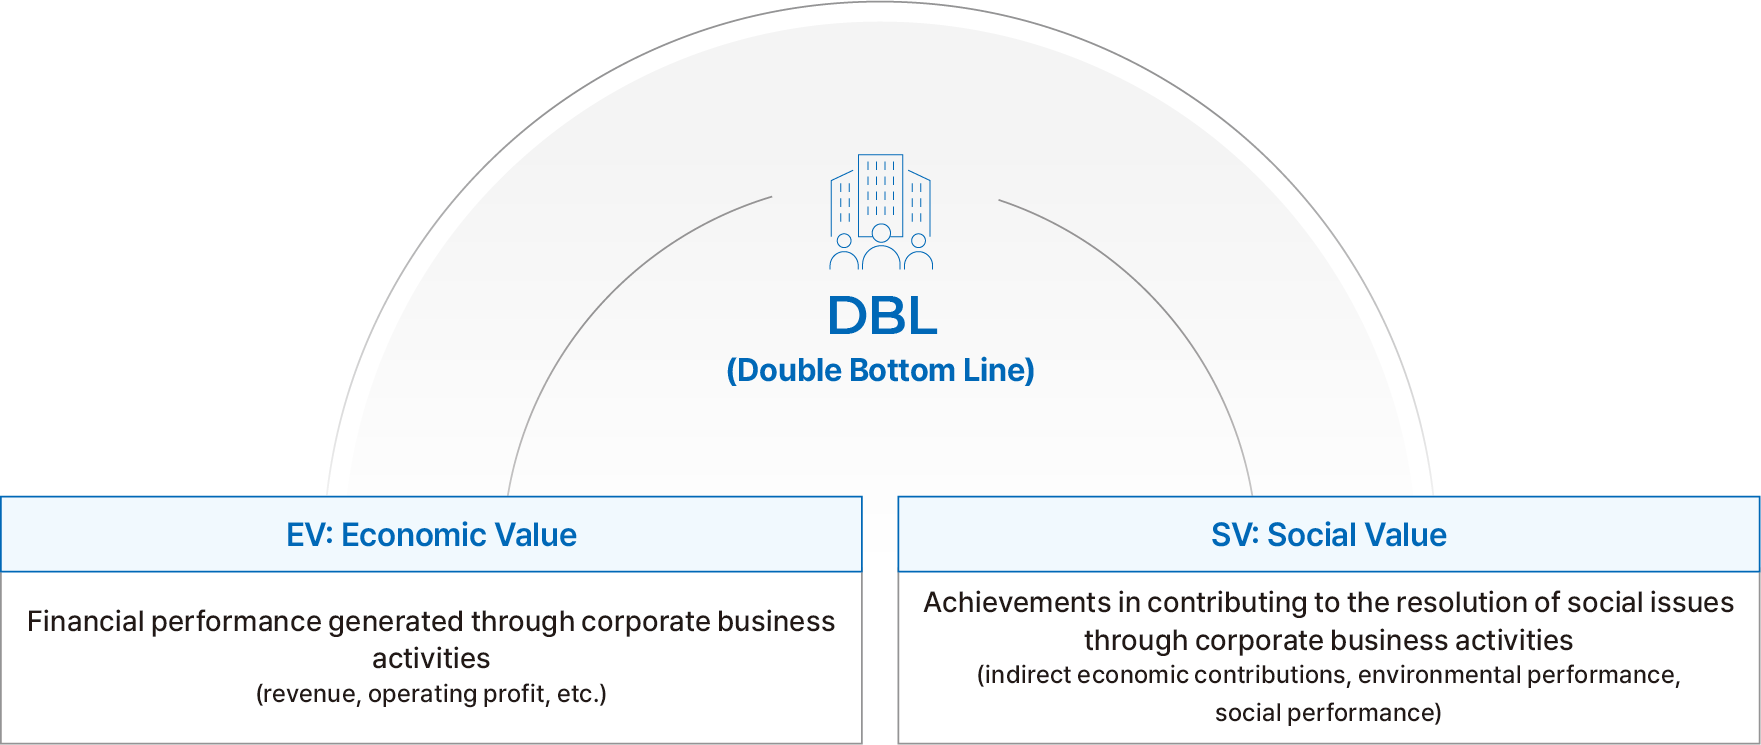
SK ecoplant is advancing its ESG management based on the SK Group’s “DBL (Double Bottom Line) Management” principle, which simultaneously pursues both economic value (EV) and social value (SV). Social value refers to the total value created by SK ecoplant’s contributions to solving social issues through its business operations. In accordance with the DBL management principle that “what cannot be measured cannot be managed,” social impact is measured in comparable monetary units and results are transparently disclosed. Based on this quantified social value, the company aims to innovate its business model to expand positive impacts and reduce negative impacts.
SK DBL (Double Bottom Line) System
Measuring Social Value
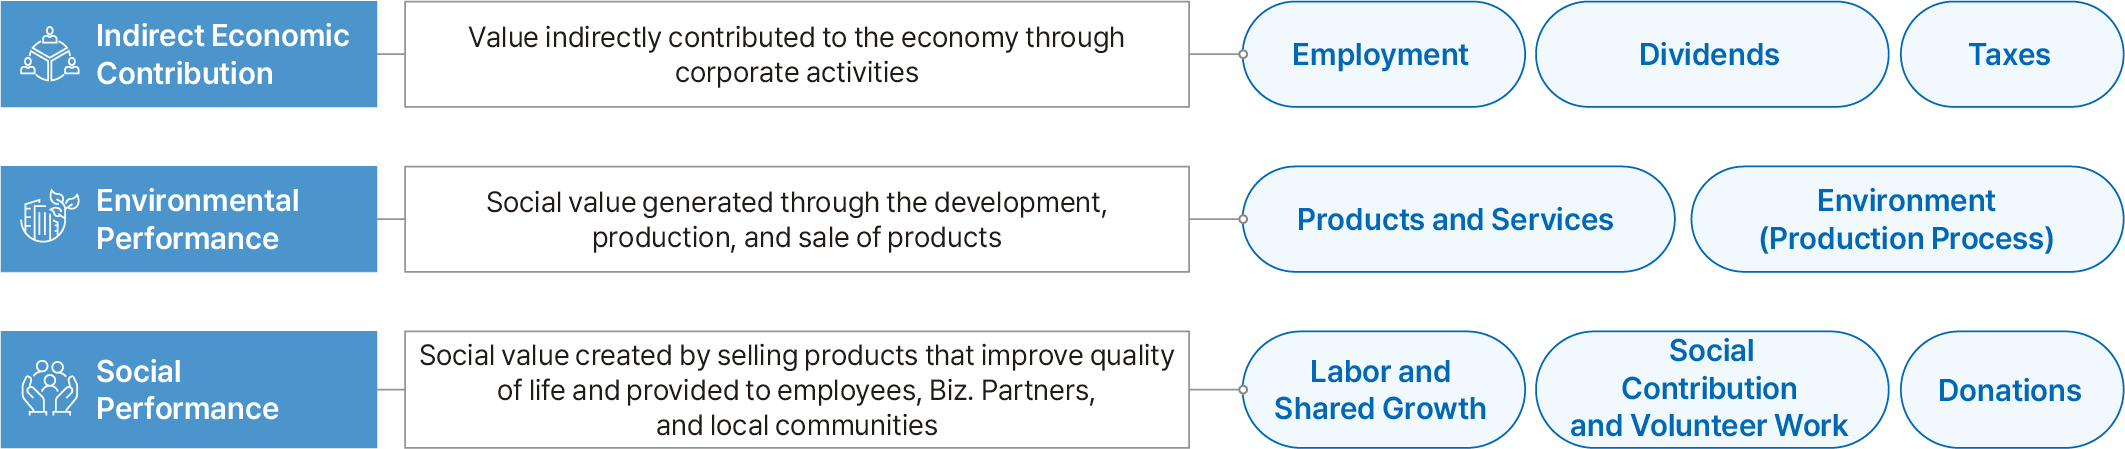
Social value is broadly categorized into “indirect economic contribution,” “environmental performance,” and “social performance,” and also includes employment, dividends, taxes, outcomes generated through products and services, shared growth, and social contributions. In particular, SK ecoplant measures and manages the social value generated by its environmental, energy and solution businesses—such as reducing greenhouse gas emissions through renewable energy and eco-friendly building projects, and reducing waste through the supply of KEco-Bar, a GFRP (Glass Fiber Reinforced Plastic) replacement for traditional rebar—to support the creation of environmental and social value within its business model. In 2025, the company created a total of KRW 764 billion in social value, including KRW 122.5 billion in environmental performance and KRW 16 billion in social performance.
Social Value Measurement Areas
Social Value Creation Results1)
Category | Indirect Economic Contributions2) | Environmental Performance | Social Performance | Total | |||||
|---|---|---|---|---|---|---|---|---|---|
2025 | Employment | Dividends | Taxes | Products and Services | Environment | Labor and | Social | Donations | |
4,109 | 296 | 1,849 | 1,253 | -28 | 129 | 17 | 14 | 7,640 | |
1) Social value creation performance is calculated annually based on the SK Group DBL Measurement Guidebook and the SV Measurement Methodology Landscape
2) Employment rose 12.3% year-over-year and tax payments increased by 1,367.5% due to higher payroll and welfare expenses, as well as increased corporate income tax and
other tax payments